May 18, 2023
Have you ever wondered how international trade really impacts our industry and your business opportunities? To answer this question, we have searched through the full list of imported and exported goods to flag those products that need corrugated packaging to protect them in transit. In a search through the U.S. Department of Commerce’s lists of exports and imports, 32 product categories were extracted for examination. Examples include all of the food and beverage categories and an assortment of other nondurable goods such as cleaning supplies and pharmaceuticals. Also included were electronics and appliances. These are the same types of goods made in the United States and packaged to protect them through the domestic supply chain to their end use. The first two tables here show how the categories were summarized.
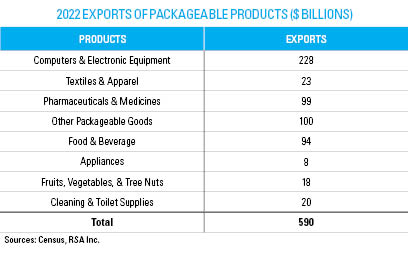
The next step is to look at detailed Commerce Department data to identify the value of exports and imports of these goods traded internationally this past year. U.S. manufacturers exported a significant quantity of packageable goods in 2022. Although we focus mainly on imports when thinking of international trade, it is important to recognize that exports provide significant additional opportunities to supply boxes and other packaging materials that wouldn’t exist without these exports. The table above summarizes the value of these exports.
Exports of packageable goods offered a large market opportunity for additional packaging beyond that sold for domestic production for goods made only for U.S. consumption. Exports totaled almost $600 billion this past year.
Packaging-intensive foods, beverages, and fresh produce accounted for a total of $112 billion, or 19% of this past year’s total of packageable goods shipments abroad. Computers and electronic equipment is the largest export category this past year, amounting to $228 billion, or almost 40% of exports requiring corrugated packaging for protection. Another standout export sector is pharmaceuticals and medicines, which totaled $99 billion.
However, international trade doesn’t just stop with exports. The trade surplus generated by this past year’s exports of packageable goods needs to be reduced for imports of the same goods. Although there is some repackaging of imported goods in the U.S., imports are by and large packed in the needed paper-based packaging at the point of manufacture.
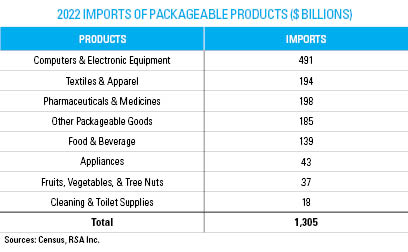
In 2022, those imports totaled $1.305 billion as is detailed in the second table above. Countries worldwide have their eye on the lucrative opportunity created by a U.S. economy tuned for consumption rather than production. A U.S. dollar some 25% stronger than justified by economic fundamentals in the U.S. manufacturing sector facilitated this avalanche of goods again this past year. It was enough to wipe out the boost U.S. exports gave to the economy and its independent paper packaging converters by more than two times over.
In the largest category, imports of computers and electronic equipment were twice the amount of this past year’s exports, thereby shrinking by more than $1 trillion the market opportunity for U.S. paper packaging suppliers. The same trend is true for other categories, as well. Imports of pharmaceuticals and medicines were about twice the level of exports.
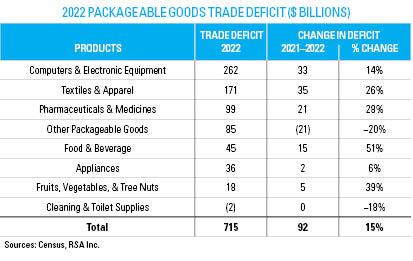
The difference between imports and exports is the trade deficit. The third table above shows the trade deficits this past year in billions of U.S. dollars. It also shows the change in the deficit from 2021. The overall trade deficit for packageable goods in 2022 was $715 billion. To get a sense of how enormous that is, consider that the gross domestic product (GDP) for the state of Ohio was $736 billion in 2021. That means the trade deficit for packageable goods in 2022 exceeded the state GDP of each state, except the seven largest states. By any measure, that is a sizeable market opportunity unavailable to producers of packaging in the U.S. Overall, the trade deficit worsened by $92 billion, or 15% this past year, compared with 2021. The trade deficit for computers and electronic equipment amounted to 37% of the total deficit and had eroded by an additional $33 billion, or 14%, this past year. Cleaning and toilet supplies and the other packageable goods categories were the only ones that did not worsen in 2022.
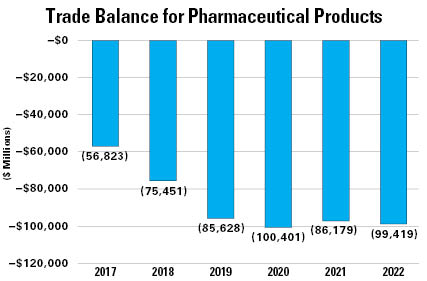
To get a sense of how the trade deficit has been worsening over time, look at the final chart, which shows how the trade deficit for pharmaceuticals and medicines has behaved since 2017. From a deficit of $57 billion in 2017, the difference between imports and exports rose to $99 billion this past year, a worsening of $42 billion.
So, the next time someone asks you how international trade affects independent paper packaging converters, just tell them it is like losing the state of Ohio from the U.S. economy. High impact, indeed.

Dick Storat is president of Richard Storat & Associates. He can be reached at 610-282-6033 or storatre@aol.com.