
August 24, 2026

The world is a busy place, and in business the most important tasks generally involve making sure the customer is taken care of, and for most employees of a converting operation, reporting that is the job of the accounting department. Lots of nonfinancial measurements that you collect every day are necessary for running your business and helping you understand your financial statements.
The historical problem has always been that the data that you need is not all within the same program, or the same database within a given program. In the past, in order to mine the data properly, even if it was in the same software package, you were at the mercy of the software vendor to create customized reporting. Thanks to advances in cloud technology and AI, those days are over, and using programs such Microsoft Power BI, Domo, Tableau, Looker, and others can revolutionize your reporting systems, by mining data from all of the databases where you currently store data and integrating it into reports and dashboards that can help you, your managers, and your key employees better manage your business.
Without getting too fancy, let’s talk about some data and statistics that you can and should add to your financial reporting package right now, which will enhance your understanding of what happened during the reporting period:
Measures of activity like MSF or tonnage information. Almost everyone has this information, and most of you utilize it incorrectly. Simply dividing sales and all expenses by MSF shipped can lead you to some very bad conclusions. There are things you need to do to make this data more useful.
Best practice here is to apply footage or tonnage manufactured to the manufacturing expenses and footage shipped to the rest of the income statement (sales, selling, shipping, etc.).
You need to apply the footage manufactured to only manufactured sales, so if you have nonmanufactured sales (resale, pack out, etc.) you need to show those sales and direct costs separately.
The best practice for that is to show contribution from manufactured sales separately from contribution from other categories of sales. Let’s say your company has $25 million in sales, and 30% of those sales are nonmanufactured, and you shipped 200,000 MSF during the period. If you simply divide total sales by MSF shipped, you will calculate an overall sales price of $125 per MSF. By applying this statistic to the manufactured sales, the calculated number will be $87.50 per MSF ($25,000,000 x 0.7)/200,000).
Similarly, labor and other plant costs per MSF will be skewed if you simply use footage shipped for these statistics. This is another reason why looking at everything as a percentage of sales can be deceiving—the sales may be out of sync with the production depending on the month, and the statistics will look artificially high or low.
Nonmanufactured sales should have a subschedule showing the material margins on these sales separately from manufactured sales. The profitability or lack thereof is often masked when they are not broken out separately.
Major machine hour information expressed in uptime, planned downtime, and unplanned downtime are also essential statistics that allow the reader to evaluate the overall efficiency of the manufacturing operation. What if your operation produced 20,000 MSF in a given month on 2,000 machine hours and only 18,000 MSF on 2,200 hours of machine time in another month? Is that something that should be looked into? Does it cause you to think differently about the efficiency of your operation? In my opinion, major machine hours available and major machine hours actually utilized in production are among the most important and underreported statistics in any converting operation. You are already tracking this information; why not add it to the financial information and begin to calculate margins per productive hour? Why not show it by machine to see where you really have capacity?
Number of shipping days in the period should be shown for all periods presented. Some months have 18 shipping days, and some have 22, so a month may be exceptionally good simply because of the number of available shipping days. In many cases inventory goes up during these months, particularly if inclement weather or other natural disasters impair shipping during a particular period.
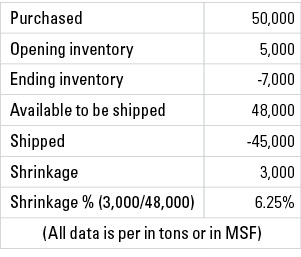
Some sort of shrinkage or sheet loss statistic should be included with your schedule of materials consumed along with information about the basis weight of the purchases as well as the percentage of white and other premium board acquired. This will help evaluate the acquisition cost of materials.
Sample shrinkage calculation:
Information about paid labor for the period should be included in the form of direct labor hours paid versus footage produced. This should exclude vacation pay, sick pay, and any other pay that is not for hours actually worked during the period. MSF produced per direct labor hour paid is one of the better measurements of productivity in the absence of a major change in mix.
Delivery expenses should include miles driven and trips made so that an average cost per mile and an average cost per trip can be calculated. Some measure of cube utilization is also important to be able to evaluate the efficiency of the operation. Some of the more advanced operations have had their driver logs scanned and put into database format. Once this is done, AI can be utilized to improve route efficiencies as well as to calculate time-per-stop information. The time devoted to each delivery can be tracked, and cost per delivery hour can be calculated for each customer. It can be illuminating to find out that some of your shorter shipments in terms of distance tie up the drivers longer than do some of the accounts with longer shipping distances.
Selling expenses should really be about the “sales department” and contain all of the expenses of your salespeople so that you can really see the cost of your salespeople as a percentage of sales. To add better analytics to this, you should show “house account” and other noncommissioned sales to better evaluate the cost of your sales effort. Since you are probably tracking new customers, new items, and the percentage of quotes that actually become orders, you can add that information as well.
In this new age of cloud-based data and artificial intelligence, lots of new relationships can be developed marrying financial and nonfinancial data that can help you do a better job of keeping your finger on the pulse of your business and better understanding the results of your operations. The cost of this has now come down significantly, and you are no longer completely at the mercy of what your software vendors want to give you. The time has come to embrace this technology and improve all of your reporting systems.

Mitch Klingher is owner of Klingher Nadler LLP. He can be reached at 201-731-3025 or mitch@klinghernadler.com.
