May 17, 2022
The math it takes to answer that question is straightforward. If exports of packageable products grew more last year than imports did, then paper-packaging converters had a larger pool of potential customers than if there was no international trade. On the other hand, if imports outgrew exports, then the potential packaging market shrank compared to its size without international trade, since the likelihood is high that the imported goods were packaged before their journey abroad and did not need as much additional corrugated or other paper packaging to protect them once they landed at our ports, compared to goods made here.
The first step to assessing this situation is to sort through internationally traded goods to identify those that consume paper packaging. For example, wheat is a large internationally traded commodity, but no paper packaging is required for it. On the other hand, small appliances are usually packaged in shelf-ready packaging where they are manufactured, not in the destination country.
We have developed a list of packaging-intensive traded goods and will investigate whether trade conditions last year expanded or contracted the domestic market for paper packaging. The table below summarizes into five categories the exports and imports of packageable goods for 2020 and 2021.
The first category includes fruit, vegetables, tree nuts, meats, poultry, and all types of manufactured food products and beverages, excluding fresh milk. Exports last year amounted to $100 billion. They rose by 7% from 2020. The value of imports of these goods was 43% higher, however, amounting to $143 billion. They grew by 8% last year, at a rate like that of exports. The net result is that imports grew by $12 billion, while exports grew by a lesser $7 billion, shrinking the trade balance by $5 billion.
Domestic manufacturers of pharmaceuticals and other medicines exported $83 billion of these high-value goods last year, a significant 24% gain over 2020’s exports. The value of last year’s imports of these products, however, was approximately double that of exports, amounting to $161 billion. Exports were $16 billion higher last year, while imports declined by $6 billion. As a result, the trade balance improved by $10 billion, affording independent paper converters that much additional packaging opportunity.
Computers and electronic equipment consume a significant amount of paper packaging to protect high-value products. In addition to computers, this category includes communications equipment such as cellphones, audio and video equipment, all sorts of measuring instruments, as well as semiconductors and other electrical components. Exports of these electronic devices and parts amounted to a substantial $218 billion last year, a gain of 12% from 2020. Imports in this category also amount to approximately double the amount of exports. They totaled $447 billion last year and rose at 18%, a faster pace than that of export growth. The impact on domestic paper packaging market size for these products worsened by $45 billion, the difference between $24 billion of export growth and $69 billion of import growth.
The appliance category includes both large appliances like washing machines and smaller products like kitchen mixers. Exports amounted to $15 billion last year and enjoyed exceptionally high growth at a rate of 75%. Imports amounted to $49 billion last year, three times the level of exports. Imports also grew rapidly last year, as consumer spending for durable goods hit a record high boosted by government COVID-related subsidies. The net result was that imports rose by $15 billion last year, while exports rose by $6 million, shrinking the domestic production market by $9 billion.
The final category includes a myriad of other products that are typically packaged in paper packaging. Most of them are nondurable goods. In total, $141 billion of these goods were exported last year, and collectively their export value grew by a robust 28%. However, when imports of these same categories of goods were added up for last year, they amounted to $380 billion and posted a similar robust growth rate—30%. Subtracting the import growth from the export growth produces a result of $87 billion of growth for imports less $31 billion of growth for exports, a decrease of $56 billion in the trade balance.
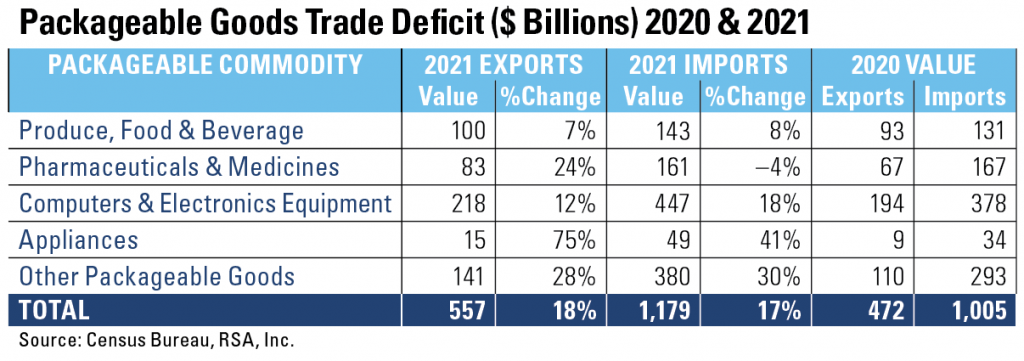
Production and packaging of these domestic goods for shipment abroad is an important part of total U.S. manufacturing production. Exports of packageable goods amounted to $557 billion last year and grew at a healthy rate of 18%, more than three times the 5.5% growth rate of U.S. industrial production last year. Unfortunately, the import side of the trade ledger overwhelmed that impressive performance. For those goods identified as packageable, imports exceeded exports by a factor of more than two, amounting to $1,179 billion last year. They also rose just as rapidly, gaining 17% in 2021. When all those numbers are crunched, the result is that during 2021 the trade balance for packageable goods dropped from a negative $553 billion to a negative $622, a worsening of $89 billion.
So, the answer is clear. Independent paper packaging producers did not benefit from international trade last year. The U.S. dollar continues to be stronger than justified by economic fundamentals in the U.S. manufacturing sector. As a result, domestic producers of packageable goods and their paper-packaging suppliers lost the opportunity to make and package $89 billion of domestically produced goods.

Dick Storat is president of Richard Storat & Associates. He can be reached at 610-282-6033 or storatre@aol.com.