August 30, 2024
In the “Back to Basics” series of articles, we discussed the following:
- Many of the key relationships that drive profitability in a paper converting operation and how to properly reflect them on your financial statements.
- The need to separate manufacturing activities from nonmanufacturing activities.
- How to create profit centers.
- Why proper categorization and the use of cost centers enhance reporting.
- The need for well-organized and concise reporting.
There is no cookie-cutter approach to reporting as every operation has a slightly different focus and different strengths and weaknesses. The framework for reporting explained in the previous article should serve as a good guide but needs to be modified to fit your particular needs and circumstances.
The key relationship in the financial statements of every converter will always be material margin. Materials will usually be between 40% and 60% of manufactured sales and 60% and 80% of brokered sales. So, what can be done to enhance the reporting of material margin, other than showing it as a percentage of sales or per MSF (thousand per square foot)? The answer really depends on how you define your profit centers. In the last installment, we showed Table 1 at the top of the income statement.
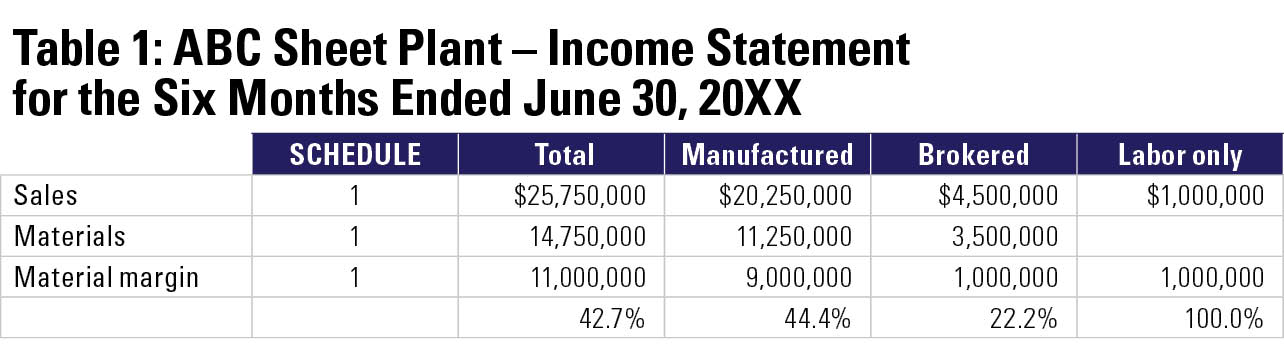
This is a good first step because it separates manufactured sales from nonmanufactured sales and gives some idea of overall margins. If we were to look at the entire mix of sales based upon 177,500 of MSF shipped and a total of 7,550 major machine hours run, we could come to the following conclusions:
- Sales per MSF: $114.10
- Margin per MSF: $50.70
- Margin per hour: $1,192
But is this enough? The company has over $20 million invested in manufacturing equipment and, with the exception of their midsize flexo, is running a one-shift operation. Its most recent acquisitions are a flatbed die cutter, a specialty folder-gluer, and a digital printer, and they need to understand how this new initiative is working out. They also need to know whether it pays to continue to run a second shift on their midsize flexo, and it would be invaluable to better understand the profitability of their other equipment. Let’s take a look at the manufactured section of Schedule 1 (see Table 2). To get this information, you need to rearrange your product codes to be machine routings, match up production data with every order, and come up with a standard allocation for multiple machine orders.
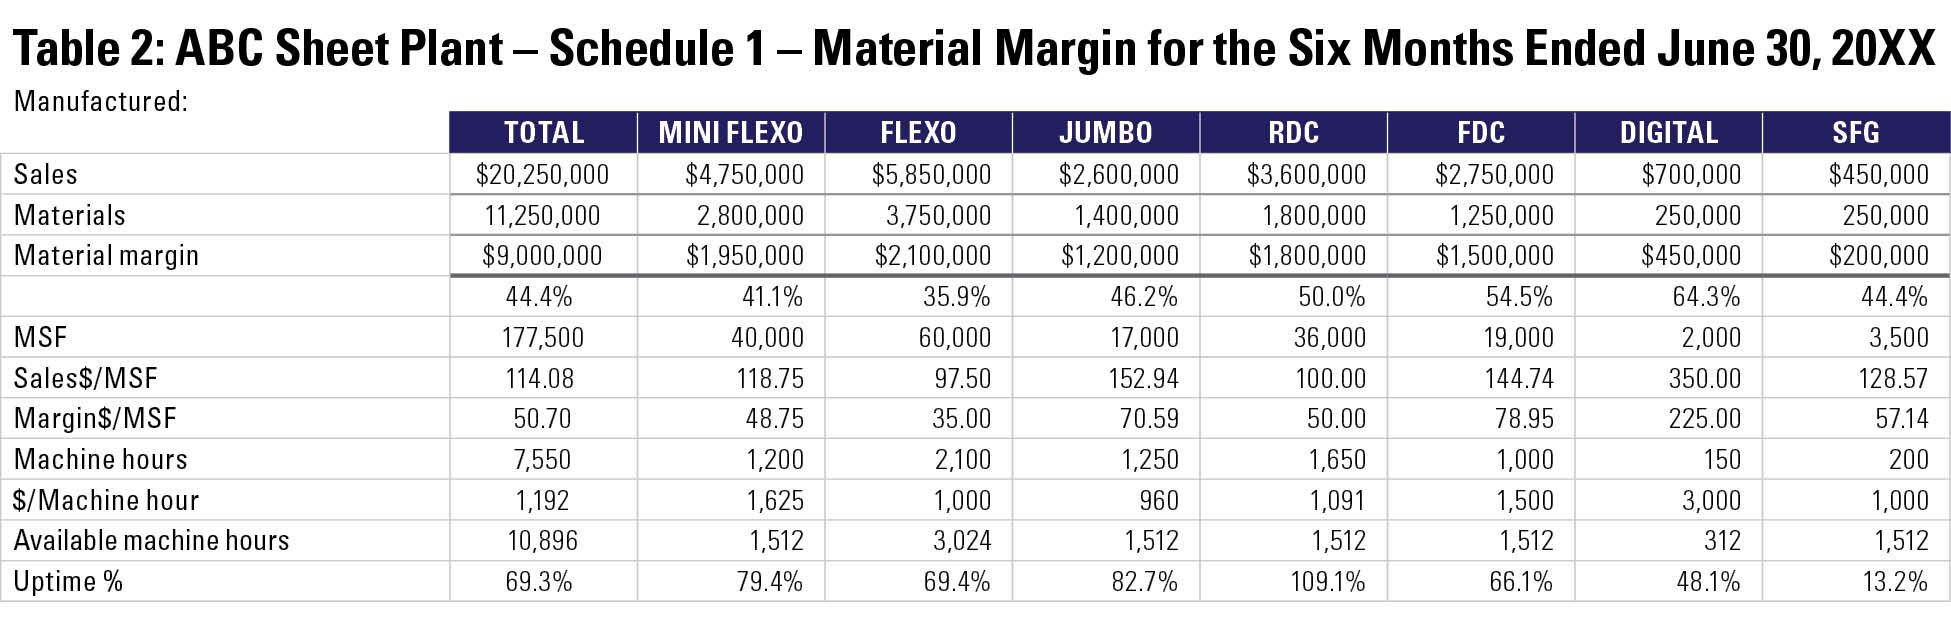
We see the same $20.25 million in sales and $9 million in material margin, but by spreading this out by machine, adding the hours run, and showing the total hours available, a very interesting and slightly different story emerges:
- The mini flexo accounts for almost as much margin as the midsize flexo on two-thirds of the overall footage and has a margin per hour that is $625 higher. With an uptime percentage of 79.4% there are definitely more hours to sell.
- The midsize flexo is crewed for two shifts, but its uptime percentage is only 69.4%. The company might be better served to eliminate the second shift entirely and focus on the more profitable midsize flexo orders. The reduction in overhead by eliminating the second shift might more than offset the lost margin from some of the lower-priced midsize flexo orders.
- The jumbo flexo is running 82.7% of the time, but even though its material margin looks pretty good at 46.2%, when looked at on an hourly basis, it is the lowest of any machine in the plant. It appears to be running very inefficiently, which is being disguised by a higher sales price and material margin.
- The rotary die cutter is performing well but is running 9.1% more hours than are actually available, so there are probably some significant overtime hours attributable to this machine center, thus raising costs a little bit. Management needs to come up with a strategy to mitigate this.
- The flatbed die cutter, digital printer, and specialty folder-gluer seem to be doing nicely, but they all need more business.
Additional information such as pieces per hour, unplanned downtime, and other data can be added here to illuminate what is going on with each machine center.
The schedule of nonmanufactured sales is also somewhat illuminating (see Table 3).
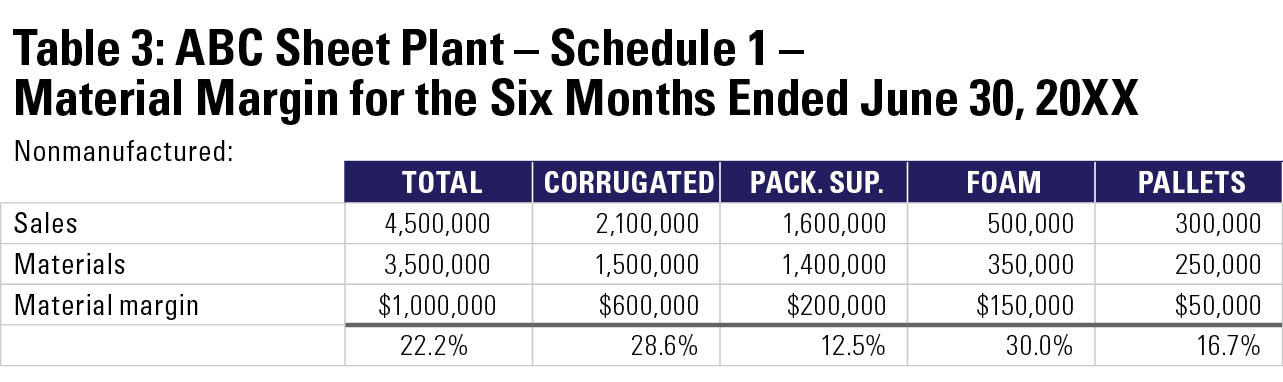
While the overall margin for nonmanufactured items is pretty good at 22.2%, breaking these sales down into their components shows a very high margin on brokered corrugated and foam and a very poor margin on pallets and packaging supplies. This is the kind of information that management needs to effectuate meaningful change.
The devil is always in the details. Companies that try to drill down to understand the different components of their businesses often have a significant edge over their competitors. Understanding material margins by profit center and focusing on the key drivers of each profit center can give you an advantage in the marketplace.
In future installments in this series, we will look at the various cost centers in a converting operation and how you may enhance your reporting on them.

Mitch Klingher is owner of Klingher Nadler LLP. He can be reached at 201-731-3025 or mitch@klinghernadler.com.