November 5, 2025

A record 3.68 million tons of North American containerboard capacity is set to close in 2025, reshaping the corrugated packaging industry and forcing a recalibration of supply, demand, and pricing dynamics. This report examines how capacity has evolved, where it may be headed, and what the implications are for producers, buyers, and investors.
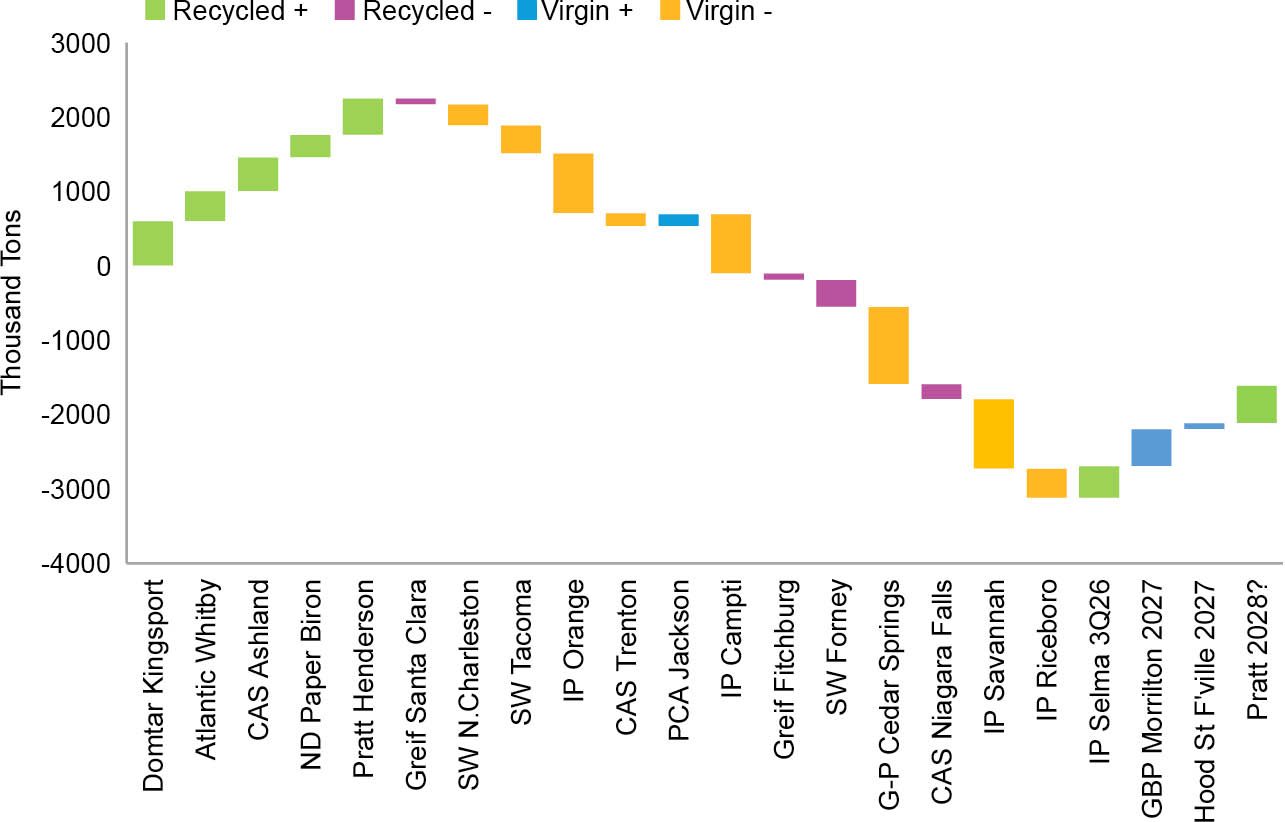
In containerboard markets, capacity refers to the volume of supply a mill can produce over a given period. The most common reference point is nameplate capacity, the figure a company provides to the public. For example, Domtar’s Kingsport, Tennessee, mill has a listed nameplate of 600,000 short tons a year.
Nameplate capacity, however, signals only a mill’s potential; it doesn’t always reflect real-world operating conditions. Effective capacity better captures actual supply to the market. The distinction is critical when assessing industry balance, pricing power, and the impacts of new investments or closures.
Industry trackers such as the American Forest & Paper Association and Numera Analytics adjust capacity for planned maintenance downtime, as well as shifts in production across multiple grades of containerboard and packaging papers. Capacity is also influenced by the ramp-up of new mills as operators resolve startup issues and gradually add customers.
What doesn’t affect capacity is unplanned downtime due to mechanical failures or quality issues. “Economic” downtime, when a mill idles for lack of demand, isn’t accounted for either—part of the reason why mill operating rates have been so low for the past two years.
A Question of Subjectivity
The difference between nameplate and effective capacity raises an important question for market analysis. If a mill allocates some machine time to grades other than containerboard, the result is lower effective capacity. That adjustment, in turn, affects the reported mill operating rates often cited as justification for price increases.
This introduces a degree of subjectivity. Operating rates can look tighter when mills divert production away from containerboard even if underlying demand is unchanged. This suggests that operating rates should be viewed as directional rather than absolute. Their value lies in signaling trends, not in gauging balances in supply and demand.
To assess true market tightness, capacity data must be paired with shipments, inventory, customer order backlogs, and demand indicators.
Closing the Gap
There will always be a gap between containerboard supply and demand in a healthy market, since producers want mills to run consistently but not at full throttle. Some margin is needed for maintenance downtime, building inventory, or handling spikes in orders. Extra room also provides flexibility to shift production across grades or redirect supply to exports when conditions change.
The challenge arises when the gap grows large enough to depress operating rates and undermine pricing power. The global financial crisis of 2008 and 2009 triggered a sharp contraction in box demand, with order volume falling 4% in 2008 and another 7.7% in 2009. Demand began to recover in 2010, rising 3.5%, and then grew slowly but steadily through the following decade.
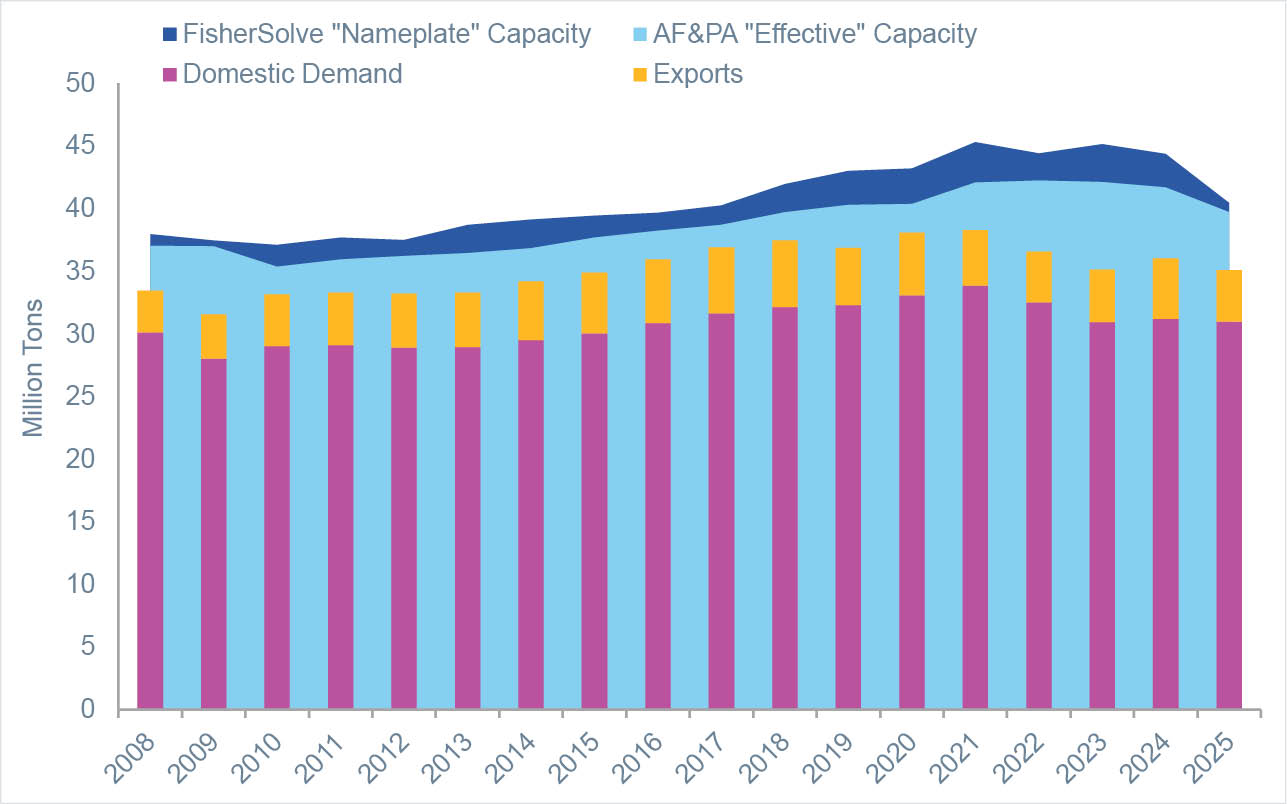
Capacity expanded more aggressively. From 2010 to 2021, nameplate containerboard capacity rose 22% to more
than 45 million tons from about 37 million. Domestic demand climbed just 16%, with the final 6% coming during the pandemic-driven surge in e-commerce.

Ryan Fox is a corrugated market analyst at Green Markets, a Bloomberg company. He can be reached at rfox93@bloomberg.net.